Introduction
Viewing real-time data from a personal weather station such as a Davis Vantage Pro, a Tempest, or an EcoWhitt device can be complex. However, the majority of systems that process weather data, such as Weather Display, Weewx, or CumlusMx, all have the ability to output MQTT data. This data can be used to display a real-time graph of the data, keeping you engaged with the latest weather updates, and supplemented with any other data which is MQTT-based.
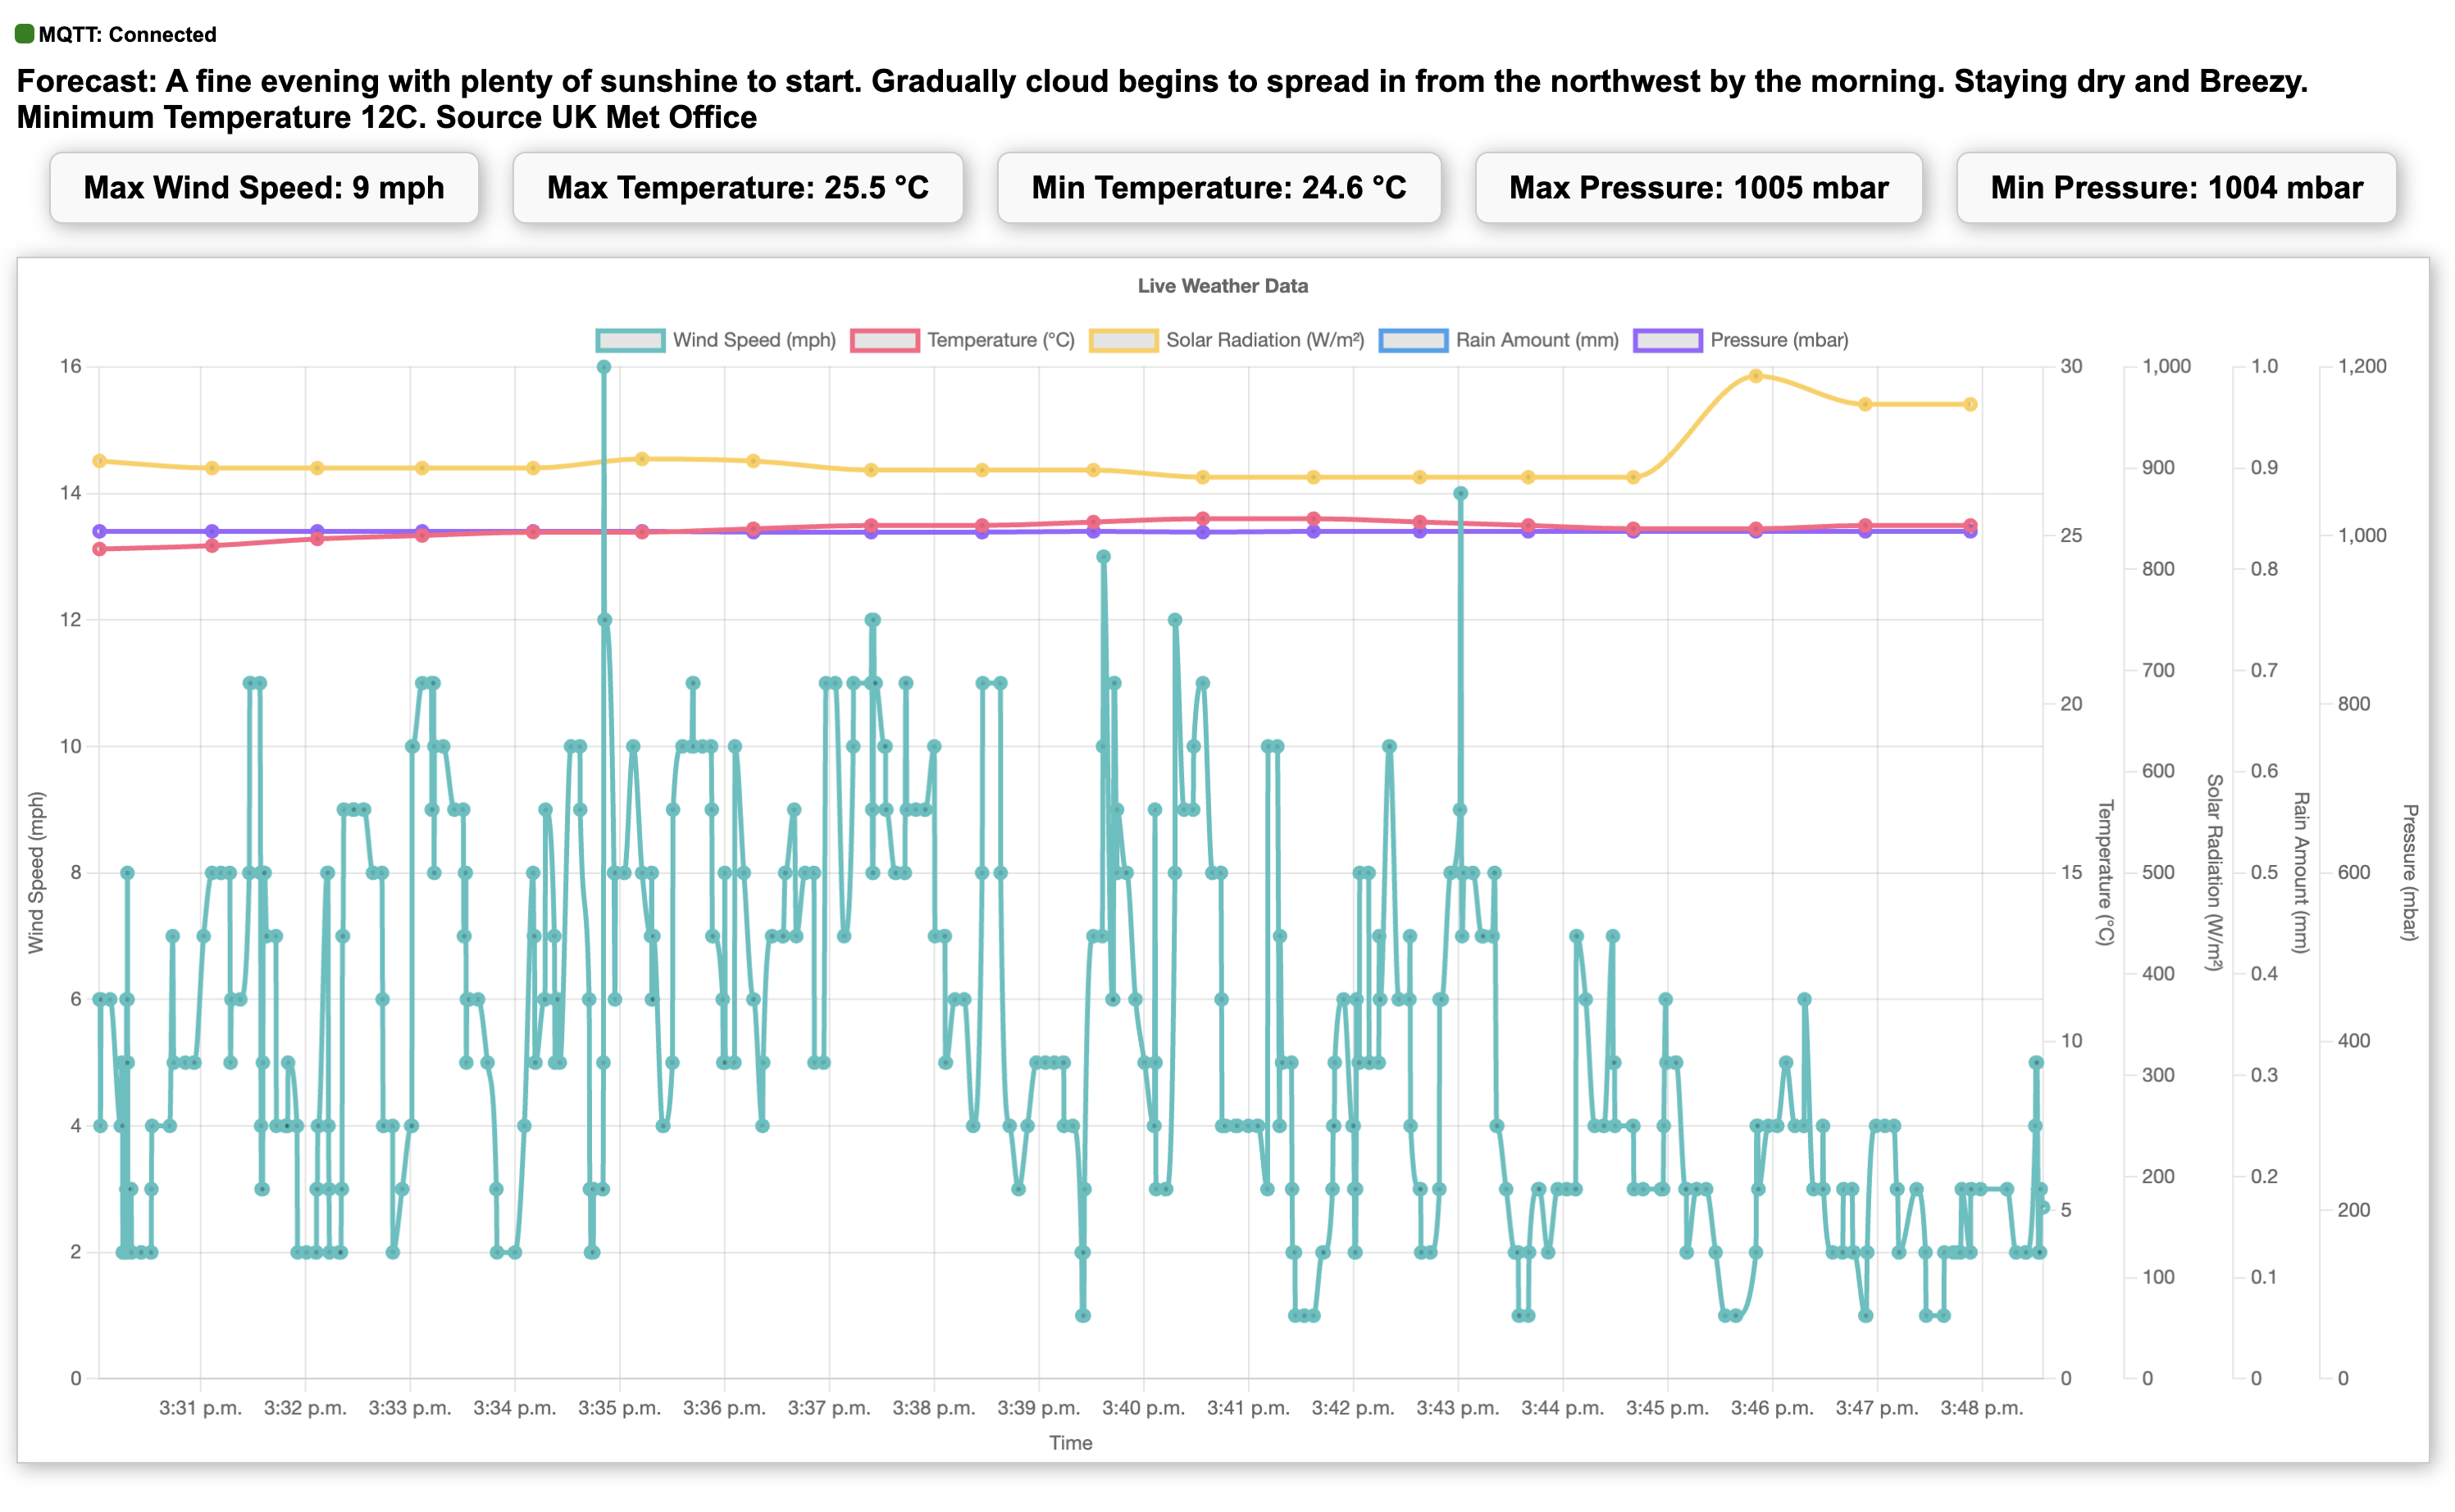
With this in mind, we’ve developed a live weather monitoring dashboard as an illustrative example. This dashboard uses MQTT for real-time data updates and Chart.js for dynamic visualization. We’ve also included a visual indicator for connection status and a brief pulse effect to notify when new data arrives, enhancing the user experience.

You can view it live at: https://finchamweather.co.uk/weathergraph.htm
The data populates as the page loads – we could of course back load it via a database link, but the aim was to simply use MQTT and have a graphing system that streams in data, its a work in progress but here is how we got it working:
Setting Up the Environment
Before we dive into the code, ensure you have the following libraries included in your HTML:
- Paho MQTT: for MQTT protocol handling – our MQTT feed is open to use as a test, replace this with your own MQTT details in the main code.
- Chart.js: for creating dynamic charts
- Chart.js adapter for date-fns: for handling time scales in charts
Initial HTML Setup
We’ll start by setting up the basic HTML structure. This includes elements for displaying the connection status, forecast, weather statistics, and the weather chart.
<!DOCTYPE html>
<html lang="en">
<head>
    <meta charset="UTF-8">
    <meta name="viewport" content="width=device-width, initial-scale=1.0">
    <meta name="apple-mobile-web-app-capable" content="yes">
    <meta name="apple-mobile-web-app-status-bar-style" content="black">
    <title>Live Weather Graph</title>
    <script src="https://cdnjs.cloudflare.com/ajax/libs/paho-mqtt/1.0.1/mqttws31.js"></script>
    <script src="https://cdn.jsdelivr.net/npm/chart.js"></script>
    <script src="https://cdn.jsdelivr.net/npm/chartjs-adapter-date-fns"></script>
    <style>
        body {
            font-family: Arial, sans-serif;
            margin: 20px;
        }
        #mqttStatus {
            margin-bottom: 20px;
            text-align: left;
            font-size: 1.2em;
        }
        .dot {
            height: 20px;
            width: 20px;
            border-radius: 50%;
            display: inline-block;
        }
        .green {
            background-color: green;
        }
        .red {
            background-color: red;
        }
        .orange {
            background-color: orange;
        }
        .pulse-once {
            animation: pulse-once 1s;
        }
        @keyframes pulse-once {
            0% { transform: scale(1); }
            50% { transform: scale(1.2); }
            100% { transform: scale(1); }
        }
        #forecast {
            margin-bottom: 20px;
            text-align: left;
            font-size: 1.2em;
            font-weight: bold;
        }
        #stats {
            display: flex;
            justify-content: center;
            gap: 20px;
            margin-bottom: 20px;
            font-size: 1.2em;
            font-weight: bold;
        }
        #stats div {
            padding: 10px 20px;
            border: 1px solid #ccc;
            border-radius: 8px;
            box-shadow: 2px 2px 12px #aaa;
            background-color: #f9f9f9;
        }
        canvas {
            border: 1px solid #ccc;
            box-shadow: 2px 2px 12px #aaa;
        }
    </style>
</head>
<body>
    <div id="mqttStatus"><span id="connectionDot" class="dot red"></span> mqtt: disconnected</div>
    <div id="forecast">Forecast: Loading...</div>
    <div id="stats">
        <div id="maxWindSpeed">Max Wind Speed: 0 mph</div>
        <div id="maxTemp">Max Temperature: 0 °C</div>
        <div id="minTemp">Min Temperature: 0 °C</div>
        <div id="maxPressure">Max Pressure: 0 mbar</div>
        <div id="minPressure">Min Pressure: 0 mbar</div>
    </div>
    <canvas id="weatherChart" width="800" height="400"></canvas>
</body>
</html>
Connecting to MQTT
Next, we set up the MQTT connection. The MQTT client will connect to the broker, subscribe to the necessary topics, and handle messages when they arrive.
// MQTT connection settings
var mqtt;
var reconnectTimeout = 2000;
var host = "mqtt.cetools.org";
var port = location.protocol === 'https:' ? 8081 : 8080;
var options = {
    timeout: 3,
    onSuccess: onConnect,
    onFailure: onFailure,
    useSSL: location.protocol === 'https:',
};
var clientID = "clientID" + parseInt(Math.random() * 100);

function updateConnectionStatus(status) {
    const dot = document.getElementById("connectionDot");
    if (status === "connected") {
        dot.className = "dot green";
        document.getElementById("mqttStatus").innerHTML = `<span class="dot green" id="connectionDot"></span> mqtt: connected`;
    } else if (status === "disconnected") {
        dot.className = "dot red";
        document.getElementById("mqttStatus").innerHTML = `<span class="dot red" id="connectionDot"></span> mqtt: disconnected`;
    } else if (status === "reconnecting") {
        dot.className = "dot orange";
        document.getElementById("mqttStatus").innerHTML = `<span class="dot orange" id="connectionDot"></span> mqtt: reconnecting`;
    }
}

function pulseDot() {
    const dot = document.getElementById("connectionDot");
    dot.classList.add("pulse-once");
    setTimeout(() => {
        dot.classList.remove("pulse-once");
    }, 1000); // Duration of the pulse-once animation
}

function onFailure(message) {
    console.log("Connection Attempt to Host " + host + " Failed: ", message.errorMessage);
    updateConnectionStatus("disconnected");
    setTimeout(MQTTconnect, reconnectTimeout);
}

function onConnect() {
    console.log("Connected ");
    updateConnectionStatus("connected");
    mqtt.subscribe("personal/ucfnaps/downhamweather/loop");
    mqtt.subscribe("personal/ucfnaps/eink/met");
}

function MQTTconnect() {
    console.log("Connecting to " + host + " on port " + port);
    updateConnectionStatus("reconnecting");
    mqtt = new Paho.MQTT.Client(host, port, clientID);
    mqtt.onMessageArrived = onMessageArrived;
    mqtt.onConnectionLost = function(responseObject) {
        if (responseObject.errorCode !== 0) {
            console.log("Connection Lost: " + responseObject.errorMessage);
            updateConnectionStatus("disconnected");
            setTimeout(MQTTconnect, reconnectTimeout);  // Attempt to reconnect
        }
    };
    mqtt.connect(options);
}

window.onload = function() {
    MQTTconnect();
}
Handling Incoming Messages
When messages arrive, we process the data and update the chart. We also update the connection dot to pulse briefly, indicating new data has been received.
let lastUpdate = Date.now();  // Initialize to current time
let firstUpdate = true;  // Flag to ensure first update happens immediately

let maxWindSpeed = 0;
let maxTemp = -Infinity;
let minTemp = Infinity;
let maxPressure = -Infinity;
let minPressure = Infinity;

function updateWindSpeed(windSpeed, timestamp) {
    weatherChart.data .labels.push(timestamp);
    weatherChart.data.datasets[0].data.push(windSpeed);

    // Update max wind speed
    if (windSpeed > maxWindSpeed) {
        maxWindSpeed = windSpeed;
        document.getElementById('maxWindSpeed').innerText = `Max Wind Speed: ${maxWindSpeed} mph`;
    }

    // Limit the number of data points to keep the chart responsive
    if (weatherChart.data.labels.length > 1440) { // Assuming 1 data point per minute, keep 24 hours of data
        weatherChart.data.labels.shift();
        weatherChart.data.datasets[0].data.shift();
    }

    weatherChart.update();
}

function updateOtherMetrics(temperature, solarRadiation, rainAmount, pressure, timestamp) {
    weatherChart.data.datasets[1].data.push({x: timestamp, y: temperature});
    weatherChart.data.datasets[2].data.push({x: timestamp, y: solarRadiation});
    weatherChart.data.datasets[3].data.push({x: timestamp, y: rainAmount > 0 ? rainAmount : null});
    weatherChart.data.datasets[4].data.push({x: timestamp, y: pressure});

    // Update max and min temperature
    if (temperature > maxTemp) {
        maxTemp = temperature;
        document.getElementById('maxTemp').innerText = `Max Temperature: ${maxTemp} °C`;
    }
    if (temperature < minTemp) { minTemp = temperature; document.getElementById('minTemp').innerText = `Min Temperature: ${minTemp} °C`; } // Update max and min pressure if (pressure > maxPressure) {
        maxPressure = pressure;
        document.getElementById('maxPressure').innerText = `Max Pressure: ${maxPressure} mbar`;
    }
    if (pressure < minPressure) { minPressure = pressure; document.getElementById('minPressure').innerText = `Min Pressure: ${minPressure} mbar`; } // Limit the number of data points to keep the chart responsive if (weatherChart.data.labels.length > 1440) { // Assuming 1 data point per minute, keep 24 hours of data
        weatherChart.data.datasets[1].data.shift();
        weatherChart.data.datasets[2].data.shift();
        weatherChart.data.datasets[3].data.shift();
        weatherChart.data.datasets[4].data.shift();
    }

    weatherChart.update();
}

function updateForecast(forecast) {
    document.getElementById('forecast').innerText = `Forecast: ${forecast}`;
}

function onMessageArrived(message) {
    console.log("Message Arrived: " + message.destinationName + " : " + message.payloadString);
    if (message.destinationName === "personal/ucfnaps/downhamweather/loop") {
        const data = JSON.parse(message.payloadString);
        const windSpeed = data['windSpeed_mph'];  // Adjust this key according to your data structure
        const temperature = data['outTemp_C'];  // Adjust this key according to your data structure
        const solarRadiation = data['radiation_Wpm2'];  // Adjust this key according to your data structure
        const rainAmount = data['dayRain_mm'];  // Adjust this key according to your data structure
        const pressure = data['pressure_mbar'];  // Adjust this key according to your data structure

        const nowTimestamp = new Date();

        // Update wind speed every time
        updateWindSpeed(windSpeed, nowTimestamp);

        if (firstUpdate || Date.now() - lastUpdate >= 60000) {
            // Update other metrics every minute
            updateOtherMetrics(temperature, solarRadiation, rainAmount, pressure, nowTimestamp);
            lastUpdate = Date.now();
            firstUpdate = false;  // Ensure subsequent updates follow the interval
        }

        // Pulse the dot when new data arrives
        pulseDot();
    } else if (message.destinationName === "personal/ucfnaps/eink/met") {
        const forecast = message.payloadString;
        updateForecast(forecast);
    }
}
Chart.js Setup
Now, let’s configure Chart.js to visualize the weather data. We will use multiple datasets to display wind speed, temperature, solar radiation, rain amount, and pressure.
// Chart.js setup
const ctx = document.getElementById('weatherChart').getContext('2d');
const weatherChart = new Chart(ctx, {
    type: 'line',
    data: {
        labels: [],  // Time labels
        datasets: [{
            label: 'Wind Speed (mph)',
            data: [],
            borderColor: 'rgba(75, 192, 192, 1)',
            borderWidth: 3,
            fill: false,
            yAxisID: 'y-axis-1',
            tension: 0.1
        },
        {
            label: 'Temperature (°C)',
            data: [],
            borderColor: 'rgba(255, 99, 132, 1)',
            borderWidth: 3,
            fill: false,
            yAxisID: 'y-axis-2',
            tension: 0.1
        },
        {
            label: 'Solar Radiation (W/m²)',
            data: [],
            borderColor: 'rgba(255, 206, 86, 1)',
            borderWidth: 3,
            fill: false,
            yAxisID: 'y-axis-3',
            tension: 0.1
        },
        {
            label: 'Rain Amount (mm)',
            data: [],
            borderColor: 'rgba(54, 162, 235, 1)',
            borderWidth: 3,
            fill: false,
            yAxisID: 'y-axis-4',
            tension: 0.1
        },
        {
            label: 'Pressure (mbar)',
            data: [],
            borderColor: 'rgba(153, 102, 255, 1)',
            borderWidth: 3,
            fill: false,
            yAxisID: 'y-axis-5',
            tension: 0.1
        }]
    },
    options: {
        responsive: true,
        plugins: {
            legend: {
                position: 'top',
            },
            title: {
                display: true,
                text: 'Live Weather Data'
            },
            decimation: {
                enabled: true,
                algorithm: 'lttb',
                samples: 100,  // Adjust this value as needed for performance
            },
        },
        scales: {
            x: {
                type: 'time',
                time: {
                    unit: 'minute'
                },
                title: {
                    display: true,
                    text: 'Time'
                }
            },
            'y-axis-1': {
                type: 'linear',
                position: 'left',
                beginAtZero: true,
                title: {
                    display: true,
                    text: 'Wind Speed (mph)'
                }
            },
            'y-axis-2': {
                type: 'linear',
                position: 'right',
                beginAtZero: true,
                title: {
                    display: true,
                    text: 'Temperature (°C)'
                },
                grid: {
                    drawOnChartArea: false
                }
            },
            'y-axis-3': {
                type: 'linear',
                position: 'right',
                beginAtZero: true,
                title: {
                    display: true,
                    text: 'Solar Radiation (W/m²)'
                },
                grid: {
                    drawOnChartArea: false
                }
            },
            'y-axis-4': {
                type: 'linear',
                position: 'right',
                beginAtZero: true,
                title: {
                    display: true,
                    text: 'Rain Amount (mm)'
                },
                grid: {
                    drawOnChartArea: false
                }
            },
            'y-axis-5': {
                type: 'linear',
                position: 'right',
                beginAtZero: true,
                title: {
                    display: true,
                    text: 'Pressure (mbar)'
                },
                grid: {
                    drawOnChartArea: false
                }
            }
        },
        interaction: {
            intersect: false,
            mode: 'nearest',
        },
        elements: {
            line: {
                cubicInterpolationMode: 'monotone',
            },
        },
    }
});
Conclusion
By integrating MQTT and Chart.js, it is possible to create a dynamic and real-time weather monitoring dashboard. The connection status indicator provides immediate feedback on the connection state, and the pulsing effect when new data arrives enhances user experience by visually notifying them of updates.
This setup can be further extended by adding more datasets, customizing the chart’s appearance, or integrating additional sensors. The data of course couple be from any feed, but real-time weather monitoring provides a good example of how IoT and web technologies can be combined to create realtime dashboards.