 While thumbing through various reports we were struck at how unimaginative a lot of geographic data visualisation is. Therefore, we thought we would try creating some components in SketchUp and link them to values for population per London Borough for 2006.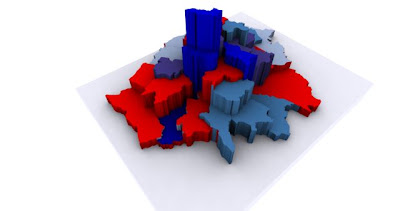
The data input was carried out manually due to errors in installing the new Arc to SketchUp plugin on Vista - thus the use of colours in the model is not linked to the data. Hopefully the plugin will be up and running shortly.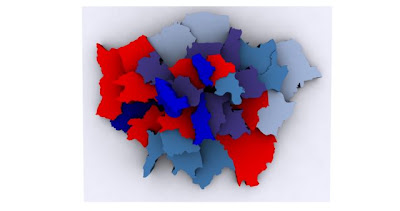 Moving from SketchUp to 3DMax allows a 'clay' render to be run on the model giving it a distinctive look. The process is quick and easy and hopefully makes the point of how easy it is to create nicer looking data visualisation.
 This is the same technique we are using on our 'Iconic London' visualisation for the real locations of the underground network. More details can be found in our previous post.